Scraping Data with Google Maps API for Market Expansion
scraping data
google maps API
Introduction
To grow our acquisition efforts and truly understand the market potential—both for Upstream and downstream buyers— we need access to the right data. This means identifying and targeting untapped potential customers, whether they are small-scale farmers, distributors, or retailers who haven't yet been engaged with our platform.
One of the most effective ways to gather this data is through data scraping, particularly from sources like Google Maps API. By utilizing Google Maps, we can collect valuable information about businesses, locations, and customer segments in both upstream and downstream markets.
Why Google Maps API?
Google Maps is a goldmine of business listings, contact details, and geographic data. By using the API, we can extract details such as:
- Business names and categories (e.g., seafood distributors, wholesale markets, feed suppliers)
- Locations and addresses
- Contact information (if available)
- User ratings and reviews (to gauge business reputation)
- Operating hours
This data helps us identify potential customers, understand their business landscape, and prioritize which regions to target for sales outreach and partnerships.
Objective
Given our diverse objectives and impact areas, we focus on gathering comprehensive market data related to fish transactions. This includes restaurants, fish markets, seafood suppliers, and other relevant businesses that play a role in the industry. By leveraging Google Maps API, we can systematically collect and analyze key information to drive acquisition and strategic decision-making.
Key Data Points We Collect
To build a well-rounded database, we extract and organize the following essential details:
- Business Name – Identifying key players in fish transactions.
- Address & Geolocation – Pinpointing exact locations for targeted outreach and analysis.
- Categories – Understanding business types (e.g., seafood restaurant, fish market, supplier).
- Phone Number – Enabling direct customer engagement and potential partnerships.
- Ratings, Reviews & Price Category – Assessing market reputation and affordability to prioritize leads.
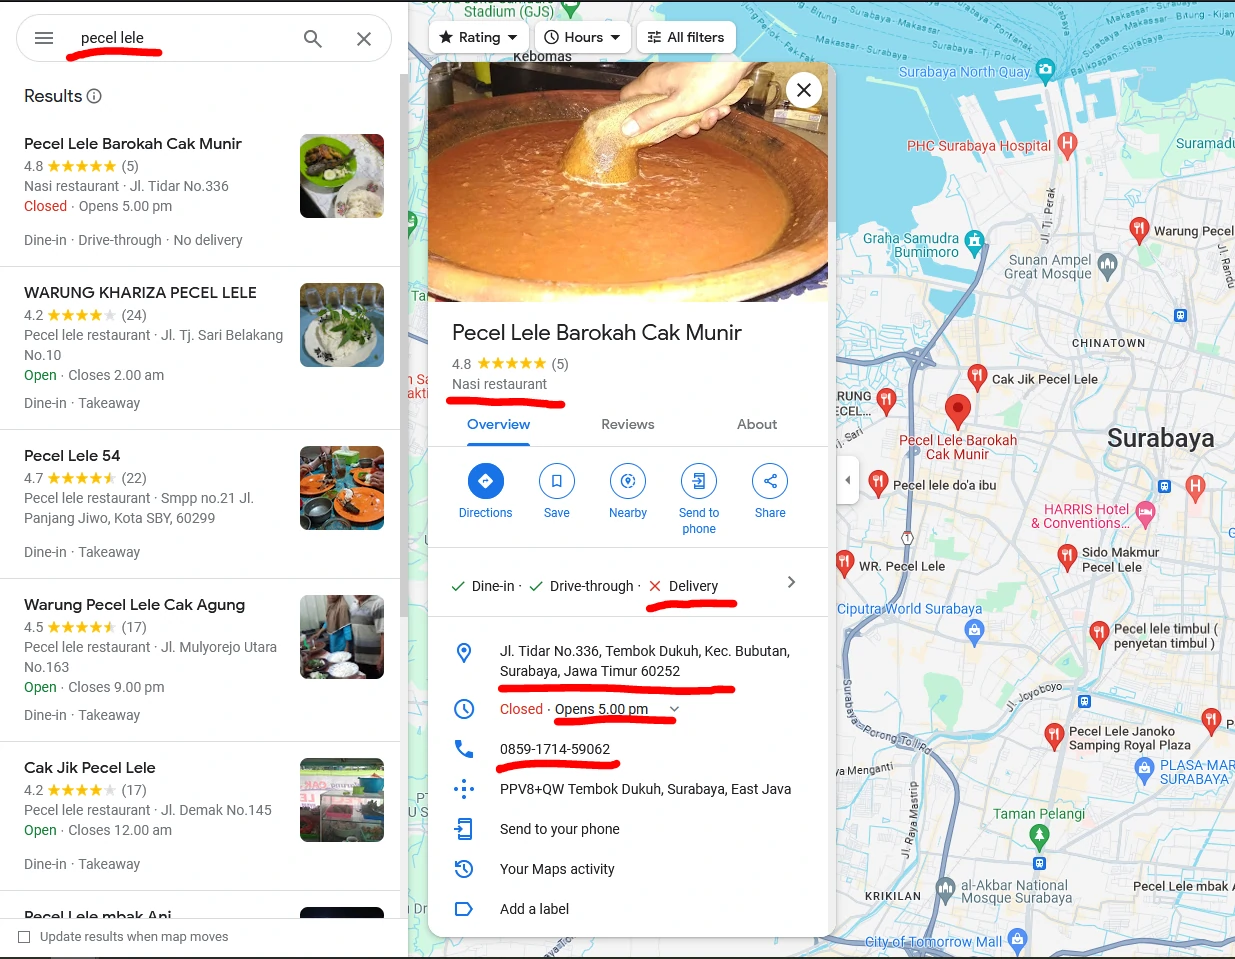
Using Keywords for Targeted Data Scraping
For projects that cater to specific customer segments, we use well-defined keywords to refine our search. This ensures we extract the most relevant businesses based on:
-
Business Categories We tailor our searches to include specific fish-related establishments, such as:
- Pecel lele – Small roadside eateries serving fried catfish, common in Indonesia.
- Depot ikan – Fish depots and wholesalers supplying fresh seafood.
- Rumah makan – General eateries that may have seafood specialties.
- HORECA (Hotels, Restaurants, Cafés) – A broad category covering hospitality businesses that source seafood.
-
Geographic Focus We refine our data collection by targeting specific locations, using administrative divisions like:
- Subdistricts (Kecamatan)
- Villages/Wards (Kelurahan)
- Regions or cities with high seafood consumption or trade
Constraints
- Limitation in google places API that only return max 60 data.
- The Google Place API didn’t return a telephone number, but we need another request for a specific place to get a phone number.
- Scraping without google API could be blocked if detected as bot.
- Using 3rd party only gives around 60-100 row data for free trial
- Using the OSM API only gives limited data due to the fact that the fact that the data comes from voluntary input.
Explorations + Decisions
There are several methods that we can use to solve our problems. Including, but not limited to:
- External trusted data sources
- Open Government data
- Survey data
- Public data
- Google map
- Google Maps Platform
- OpenStreetMap (OSM) data
- OSM API
- 3rd party tools
- http://apify.com
- https://www.scrapehero.com/
- https://serpapi.com/
- https://www.octoparse.com/
- https://scrapy.org/
- Manual scraping
- Using programing languages such as python or javascript.
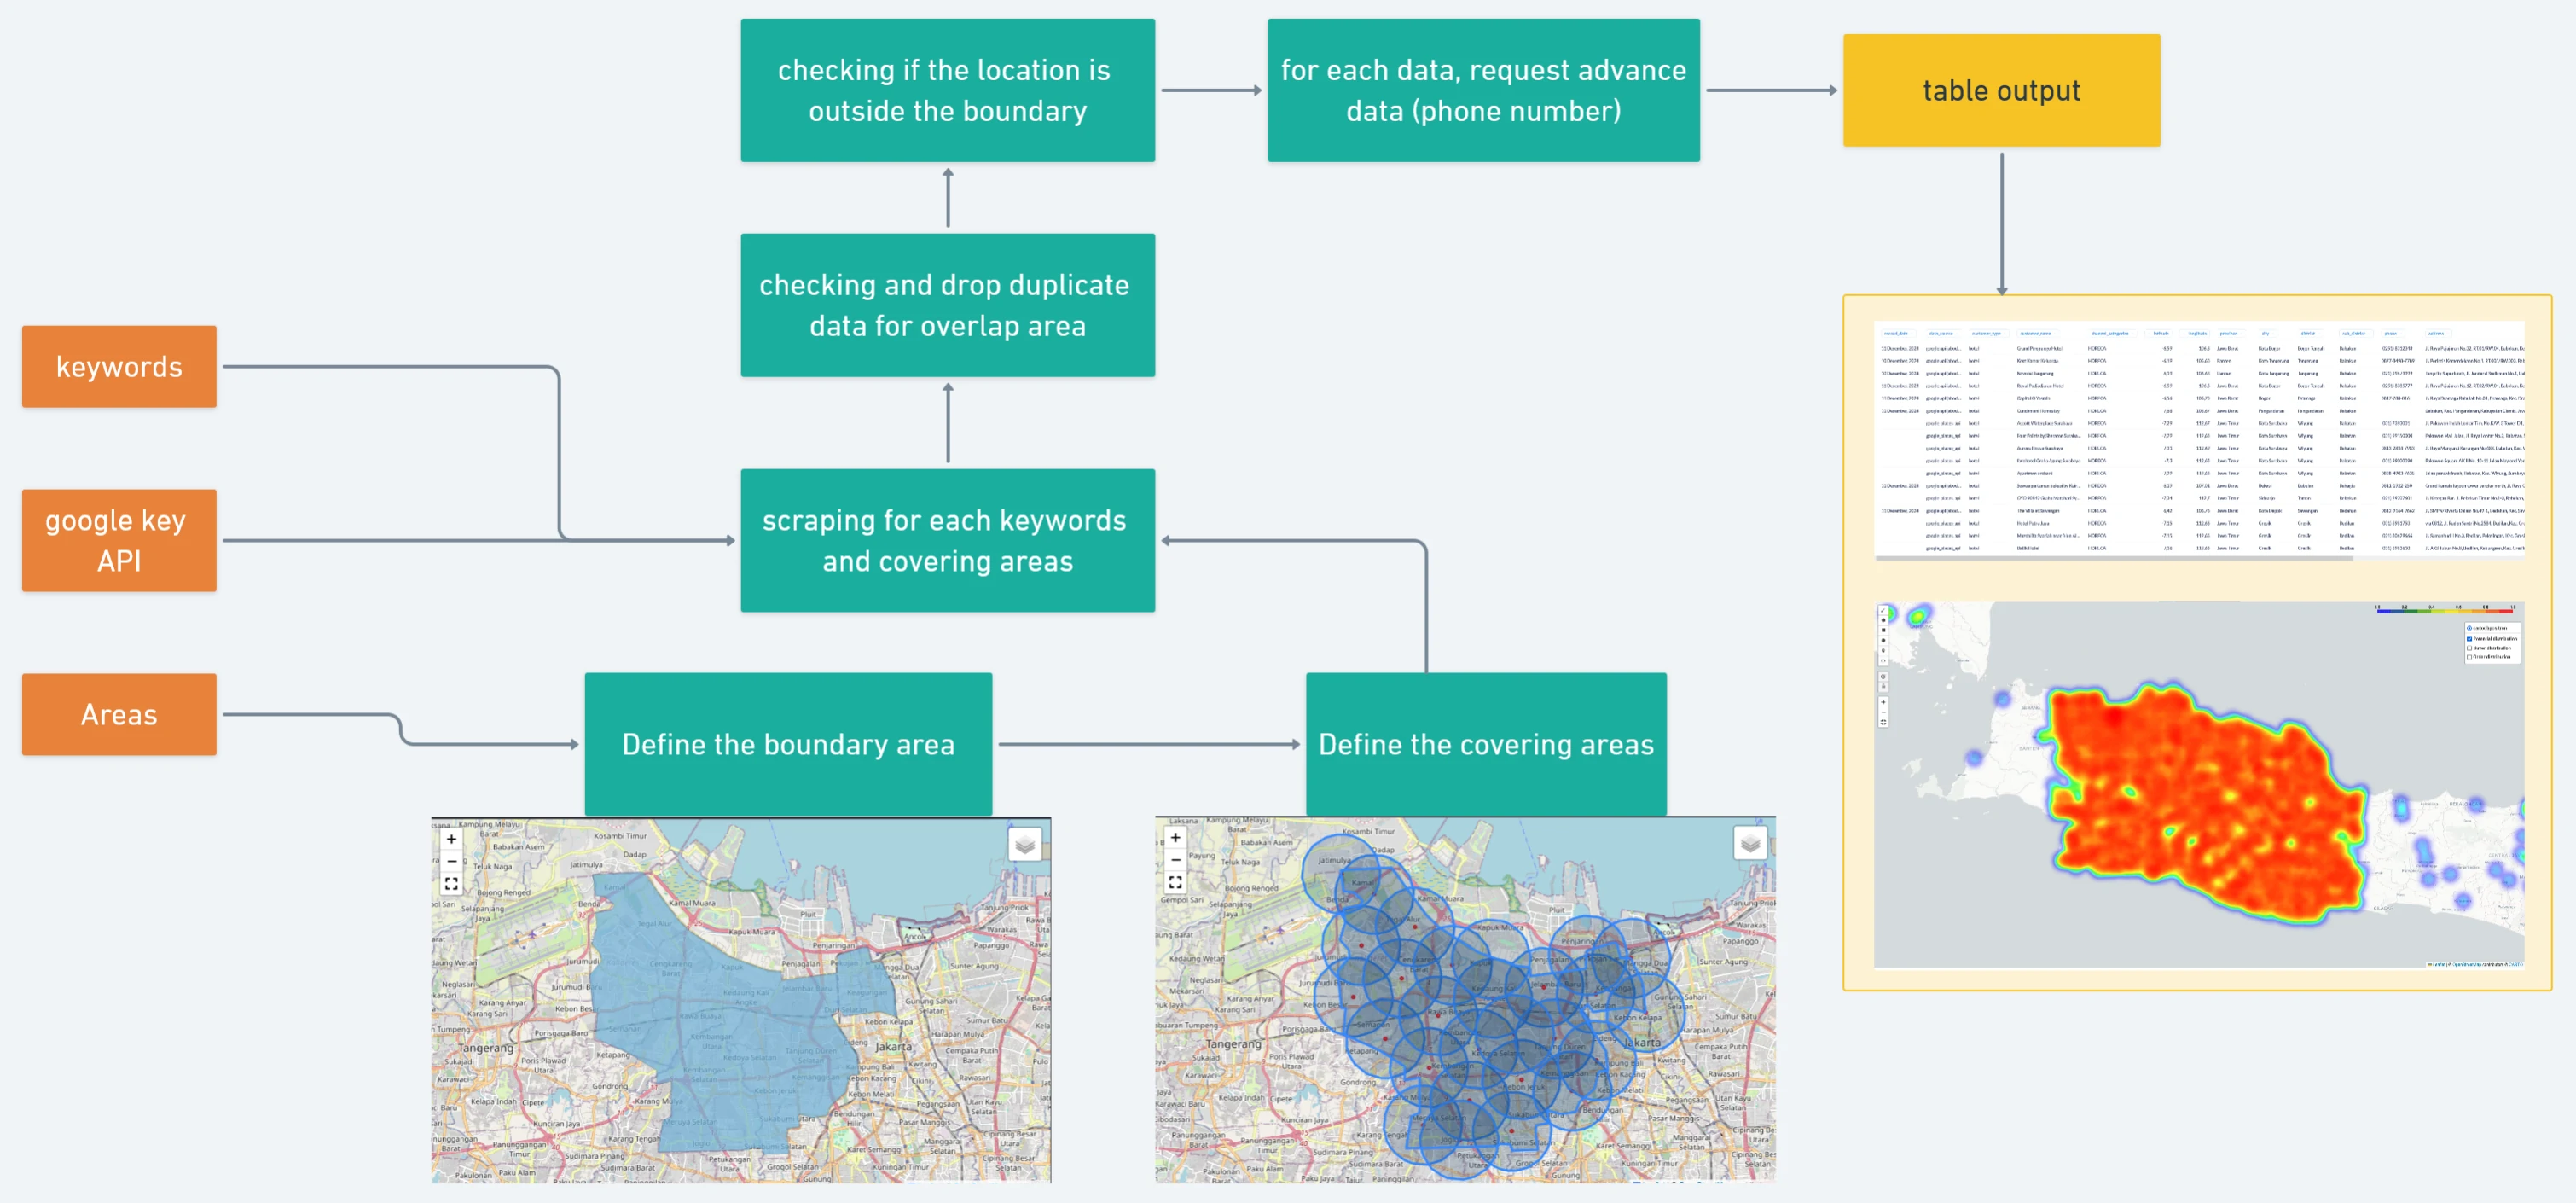
Technical Details
To ensure accurate and comprehensive data collection, we use two primary methods: Area-Level Querying and Covering Radius Method. Each method has its advantages depending on the region’s size, structure, and data availability.
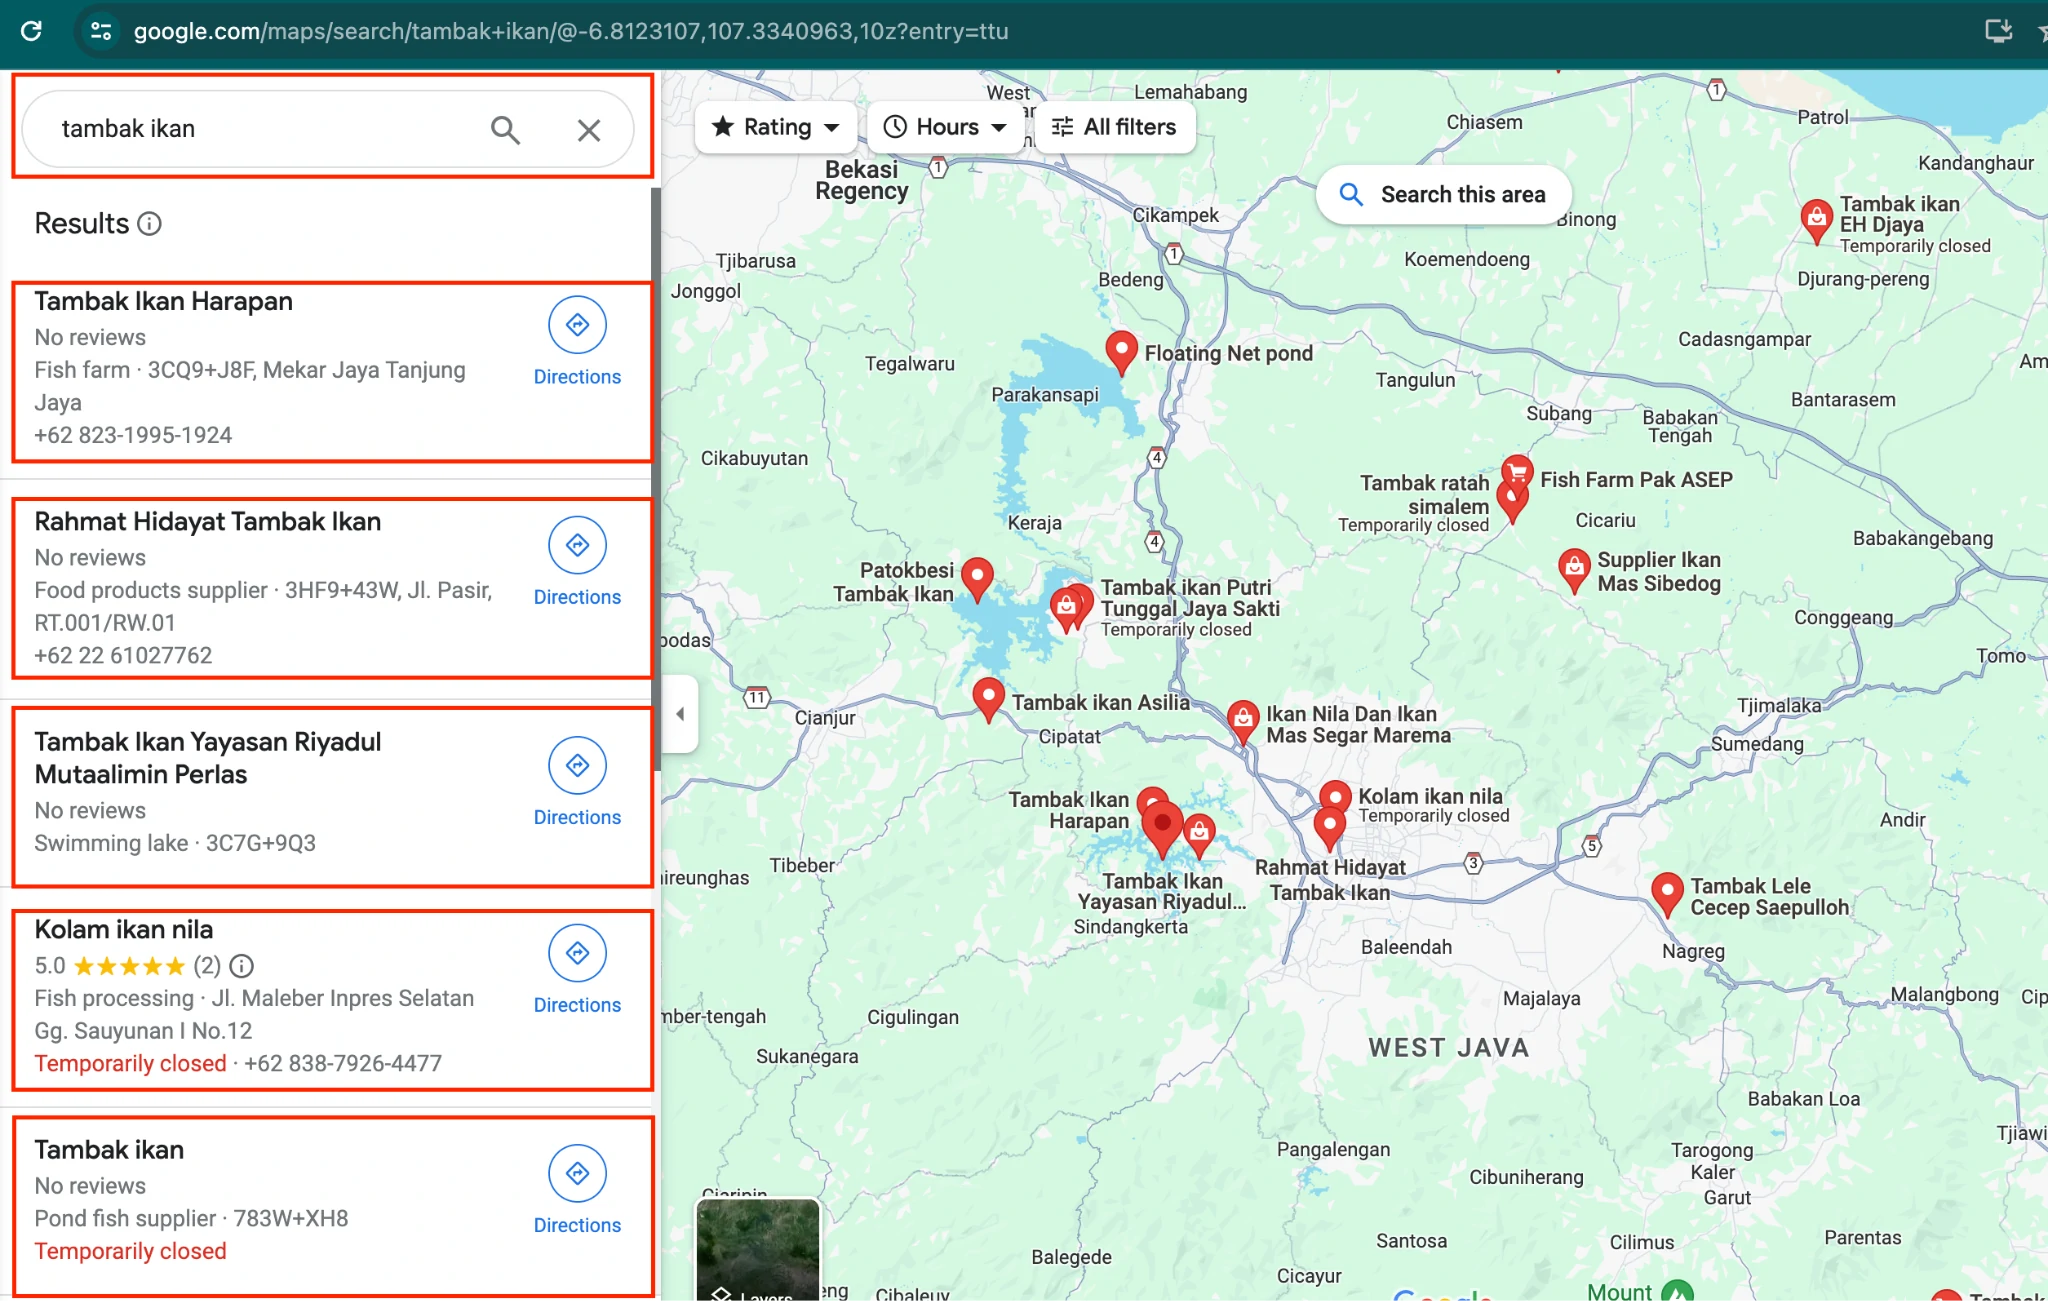
Get the Data Using Area-Level Querying
This method allows us to precisely target locations by specifying both administrative boundaries and keywords.
How It Works
- We define a minimum administrative region (e.g., subdistrict, city, or province) to focus on.
- We use predefined location coordinates (latitude/longitude) to set boundaries and exclude unwanted results.
- We apply specific keywords (e.g., pecel lele, seafood market, HORECA) to filter relevant businesses.
Input data
areas = ['amplas','bandar khalipah','bandar klippa','bandar setia','cinta damai','cinta rakyat','kolam','laut dendang','medan estate','pematang lalang','percut','saentis',
        'sampali','sei rotan','sumber rejo timur','tanjung rejo','tanjung selamat tembung','kenangan','kenangan baru', #percut sei tuan
        'bakaran batu','baru','batang kuis pekan','bintang meriah','mesjid','paya gambar','sena','sidodadi','sugiharjo','tanjung sari','tumpatan nibung', #batang kuis
        'helvetia','manunggal','pematang johar', #labuhan deli
        'lantasan lama','marindal dua','marindal satu','patumbak dua','patumbak kampung','sigara gara', #patumbak
        'bangun sari','buntu bedimbar','ujung serdang', #tanjung morawa
        'klambir lima kebon','klumpang kebon'] #hamparan perak
keywords = ['lapak ikan', 'pecel lele', 'depot ikan', 'ikan segar', 'seafood', 'rumah makan', 'Warung Sayur', 'hotel', 'superindo', 'supermarket','restoran']
place = 'medan'
place = 'kabupaten deli serdang'
level = 'desa'
boundaries = [3.44,3.84,98.50,98.82]
key = 'API key'
Query
query=(word, f"di {area} {prov}")
The code
raw_collection_data, collection_data, collection_data_detail, areas_search = maps.search_data(areas, level, place, keywords, methods='center_area', key=key , boundaries=boundaries)
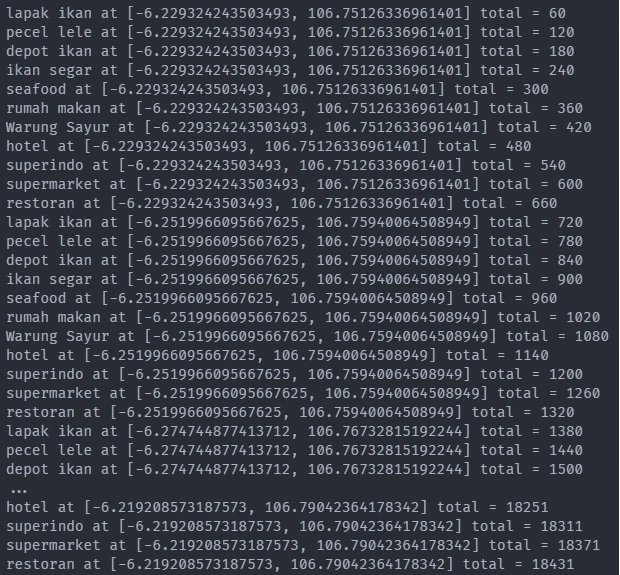
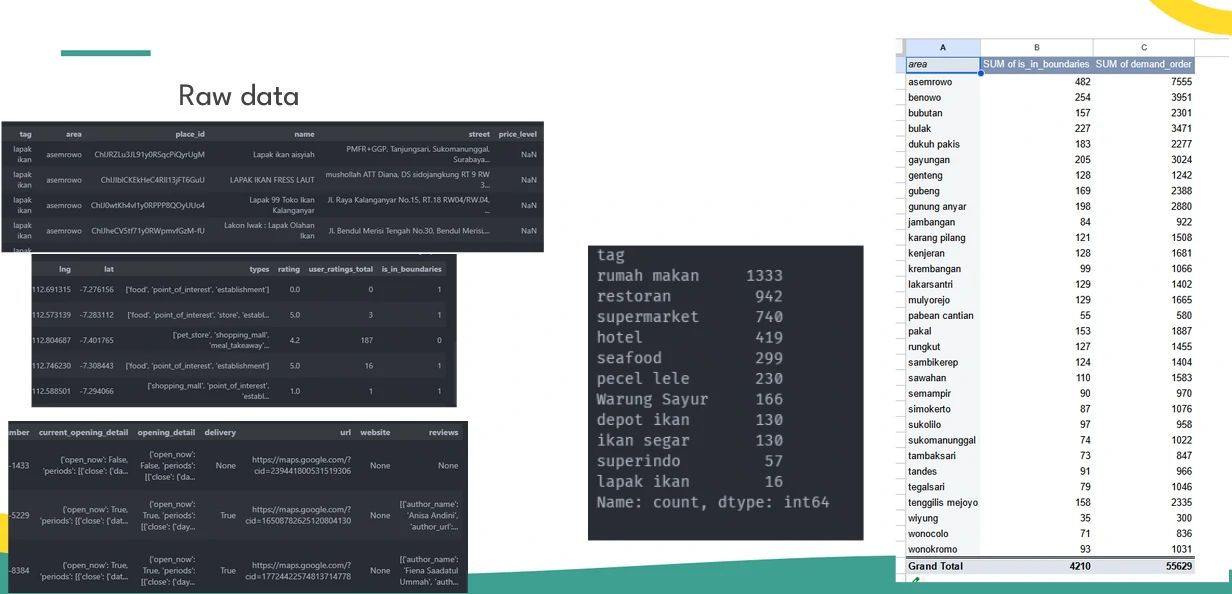
Output
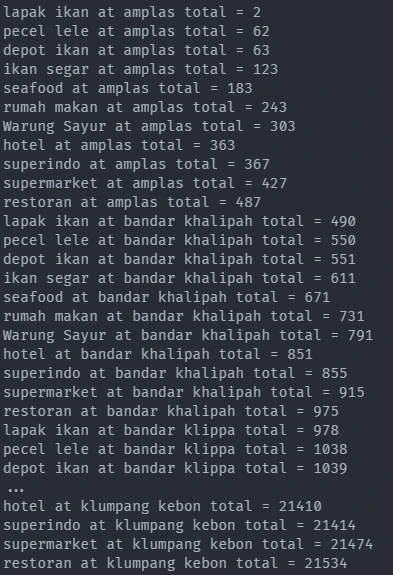
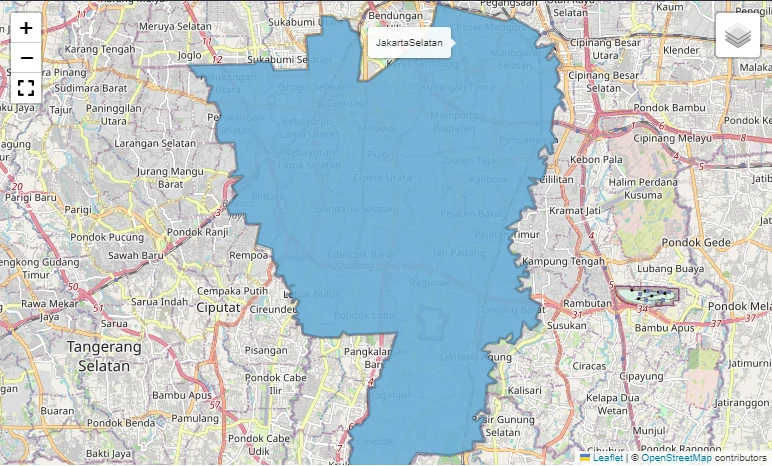
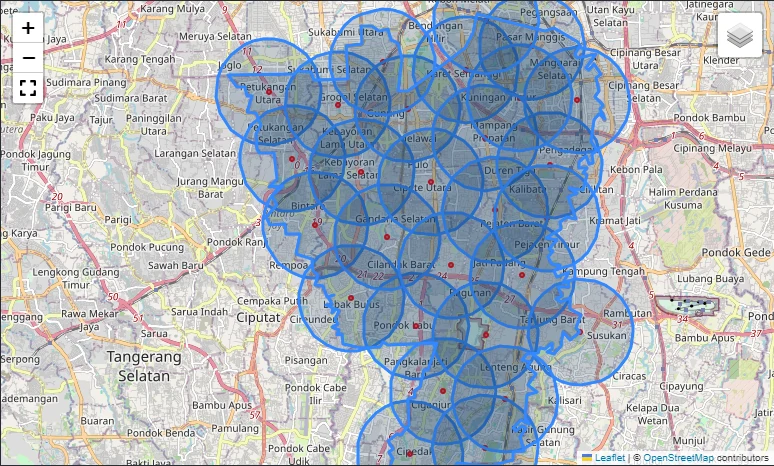
Get the data using Covering radius
another method is using Covering Radius. By utilizing Covering Radius, we can efficiently covering a given area with minimal circular regions is a powerful method for obtaining localized information, especially when querying services like the Google Maps API, which often limits searches to a specific radius.
How It Works
- We divide a large target area into smaller circular regions using a set radius (e.g., 5 km per search query).
- Each circle covers part of the area while overlapping slightly to ensure full coverage.
- We adjust the radius size based on business density—smaller for dense cities, larger for rural areas.
Input data
radius = 2000
kab = 'JakartaSelatan'
prov = 'jakarta'
keywords = ['lapak ikan', 'pecel lele', 'depot ikan', 'ikan segar', 'seafood', 'rumah makan', 'Warung Sayur', 'hotel', 'superindo', 'supermarket','restoran']
city = 'Jakarta selatan'
boundaries = [-6.3725,-6.2016,106.7286,106.8713]
key = 'API key'
The code
result = maps.radius_covering(sharp_map_selected, radius, meter_crs= 'EPSG:32748', deg_crs='EPSG:4326')
The code
raw_collection_data, collection_data, collection_data_detail = maps.search_data_coord(result, prov=prov, city=city, radius = radius,
                  keywords=keywords, boundaries=boundaries, key=key)
Output
Final Schema
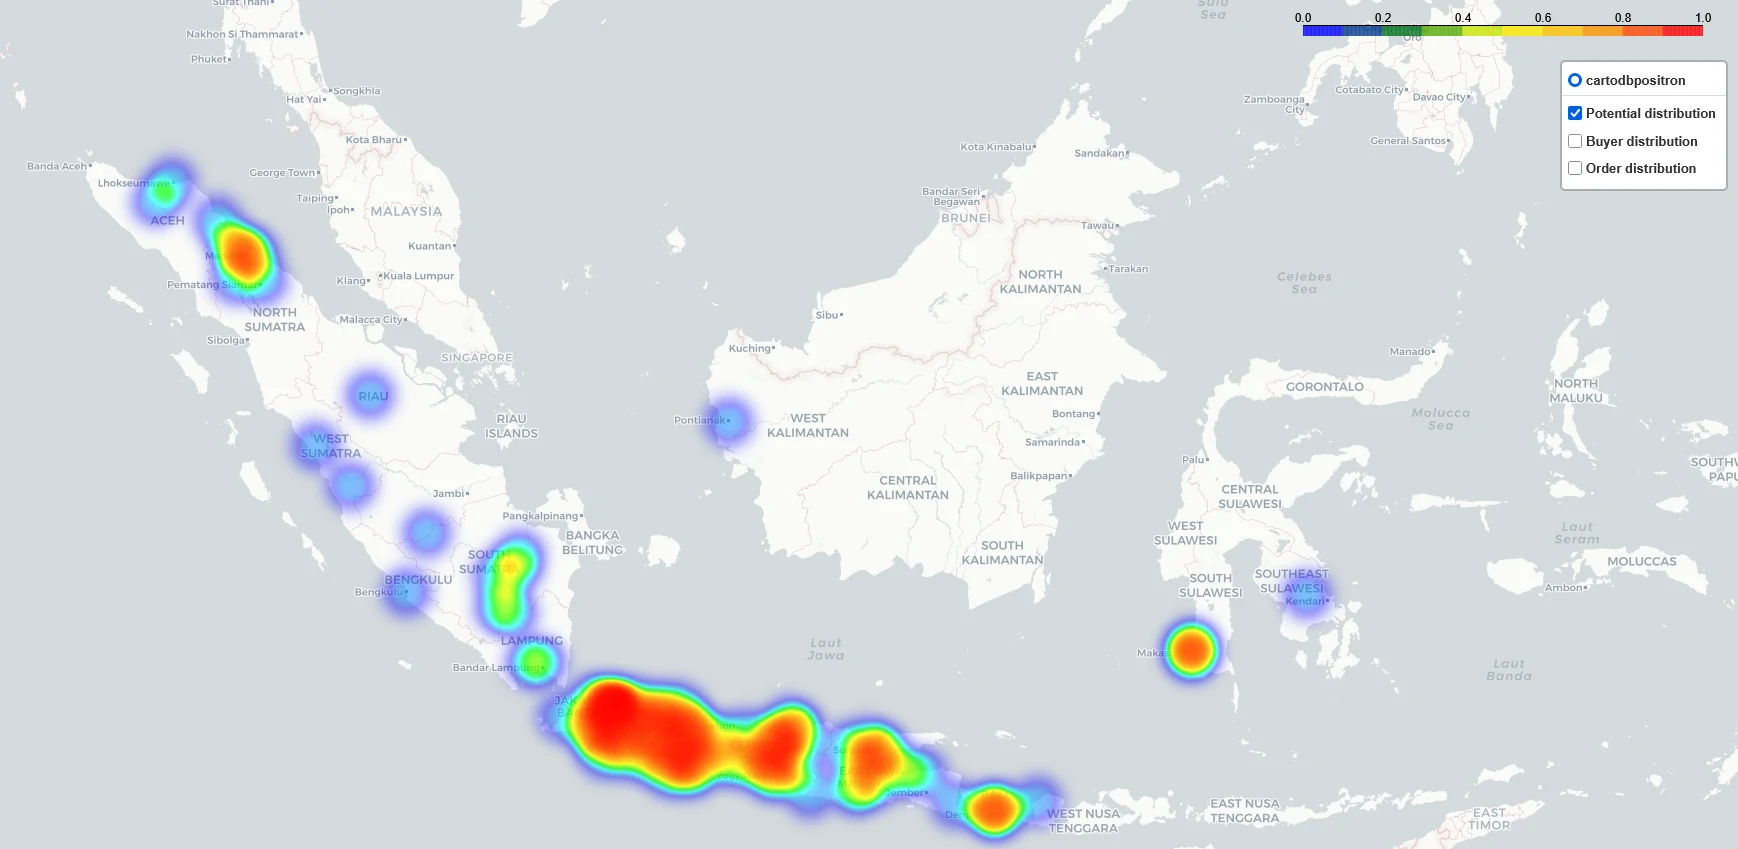
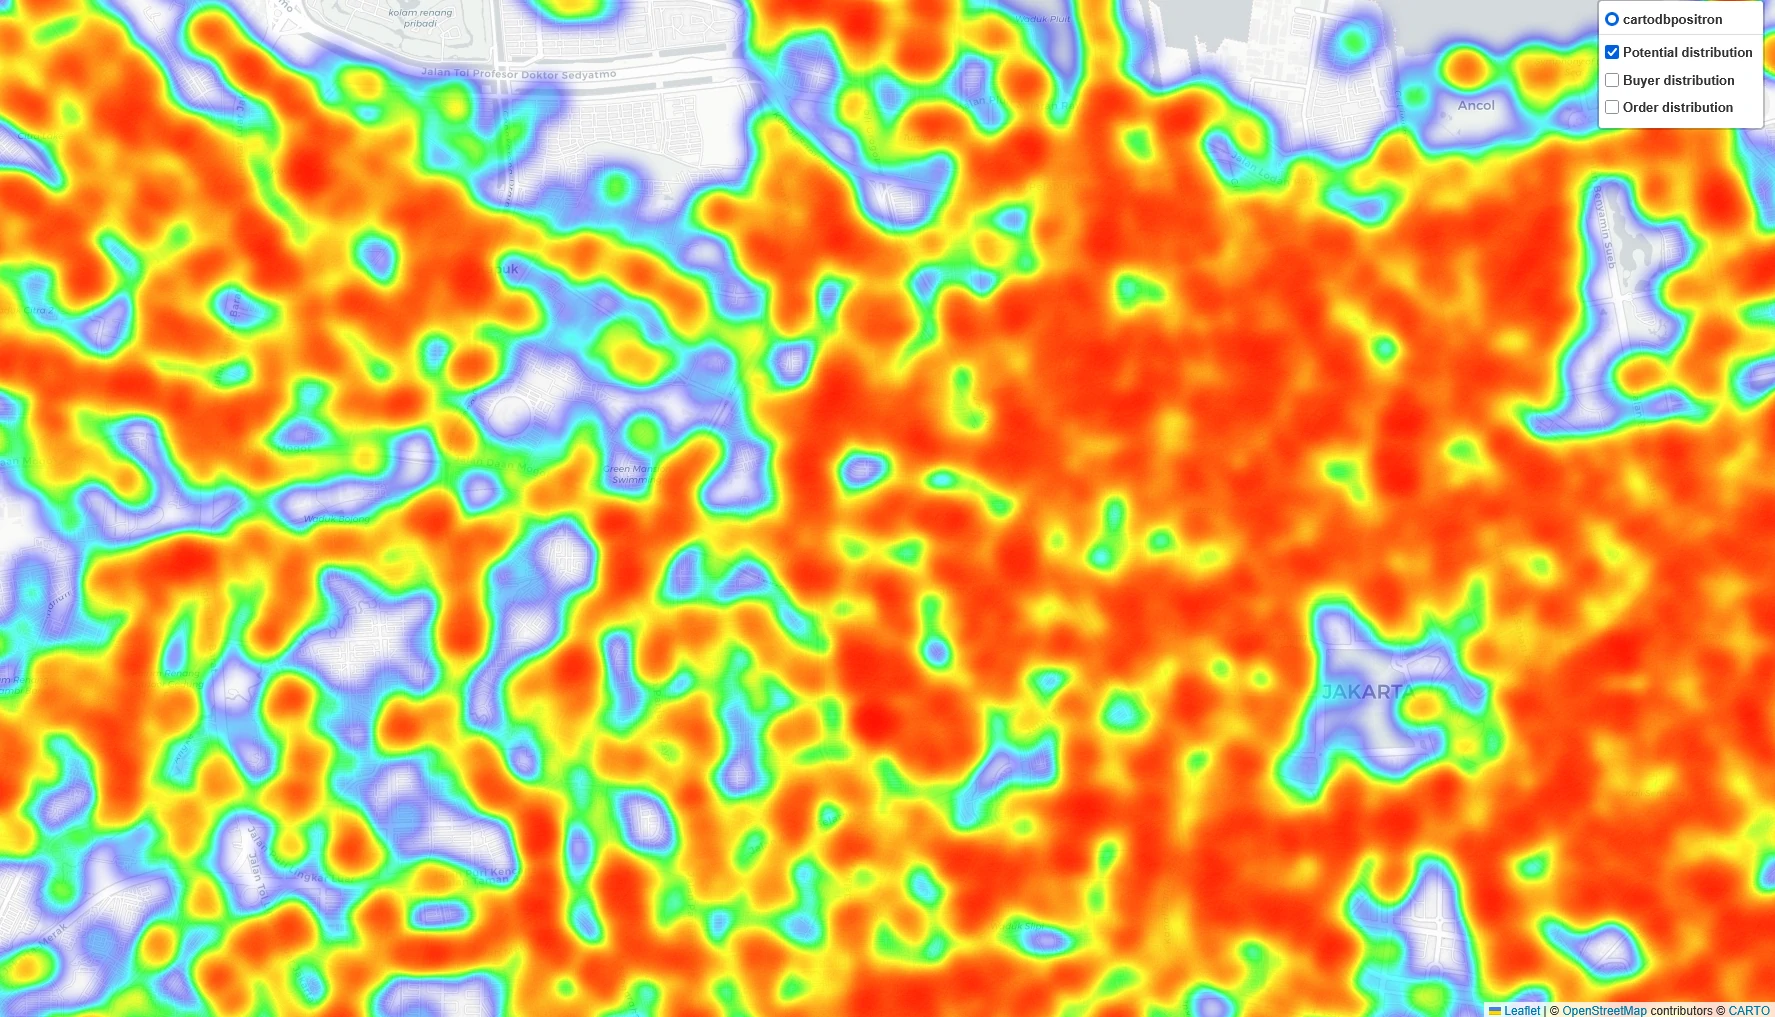
The Result
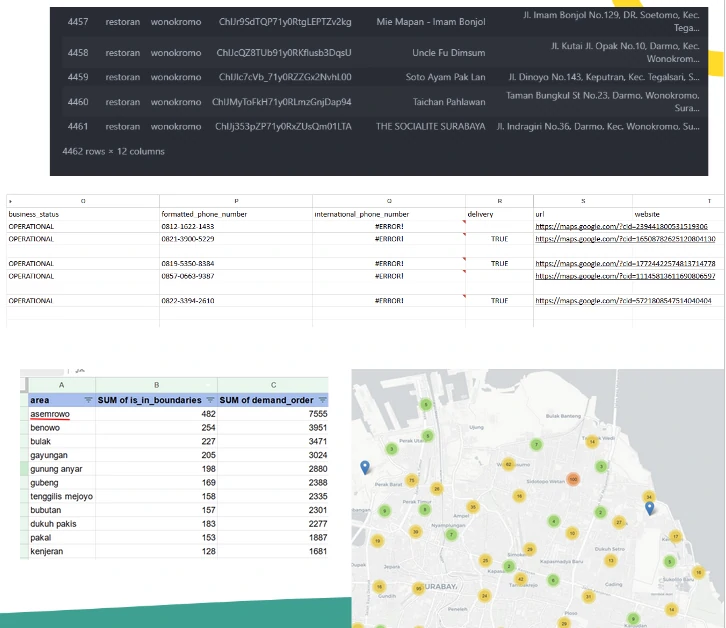
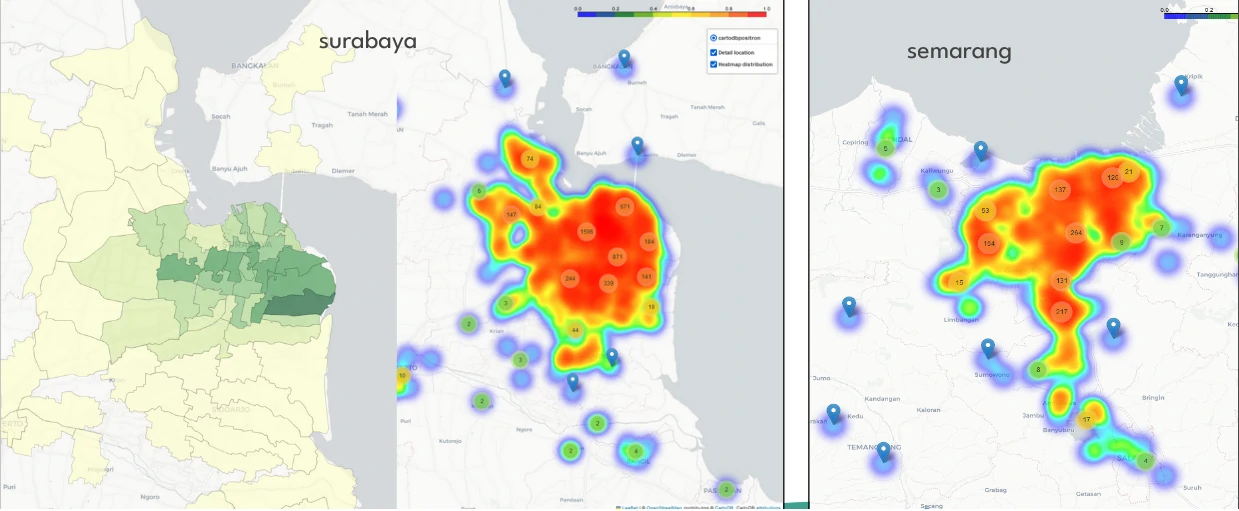
Maximizing Downstream Growth with Google Maps Data
By utilizing Google Maps data, we can strategically expand our downstream market, particularly by identifying potential buyers such as restaurants, fish markets, and seafood distributors. This data-driven approach allows us to make informed business decisions and optimize acquisition strategies.
Key Benefits of Using This Data in the Downstream Sector
- Estimating the Number of New Customers. With structured business listings, we can analyze:
- The total number of potential leads in a given area.
- The density of fish-related businesses in key regions.
- The growth potential of our customer base.
- This helps in setting realistic acquisition goals and prioritizing high-potential markets.
- Estimating Demand and Revenue Potential. By analyzing business type, size, and customer traffic (based on ratings/reviews), we can:
- Predict weekly/monthly seafood demand per customer.
- Estimate total revenue potential from new customer acquisitions.
- Identify high-value customers, such as large seafood restaurants and hotel chains, that generate higher order volumes.
- Defining Target Focus Areas. Using geolocation data, we can determine which areas offer the highest return on investment.
- High-density areas with seafood businesses indicate strong demand.
- Emerging areas with fewer suppliers present opportunities for first-mover advantage.
- Strategic hubs like fish markets and wholesale depots allow for efficient supply chain optimization.
- Crafting an Effective Customer Approach. Once we identify target businesses, we strategize how to engage them effectively:
- Online Outreach: Digital marketing campaigns, WhatsApp/email sales pitches, or social media engagement.
- Offline Approaches: On-ground sales visits, networking at seafood trade fairs, or in-person product demonstrations.
- Hybrid Model: A mix of online and offline engagement based on business type and readiness to adopt digital solutions.
Final Thoughts
With this structured, data-driven approach, we can:
- ✅ Maximize customer acquisition by focusing on high-potential buyers.
- ✅ Increase revenue predictability with demand-based insights.
- ✅ Optimize resource allocation for targeted marketing and sales.
- ✅ Ensures that our acquisition efforts are focused, efficient, and backed by real-world data rather than assumptions.
By continuously refining our approach, we ensure that we are not just expanding our customer base—but also making strategic, informed decisions that drive long-term growth.